


|
|
Description
This screen enables you to create or edit your reports. Indeed, Hikashop gives you the possibility to generate reports based on your shop data. Through graphs, tables, pies and many other charts you will be able to visualize your shop information such as the number of sales this month, the best product sold this year or the evolution of your sales during the 10 lasts days. The flexibility of this report tool will allow you to create specific reports fitting your needs.
Reports are available in both the Essential and the Business edition of HikaShop.
You can access this screen by clicking on the menu Components->HikaShop and then on the HikaShop menu Orders->Reports in your back end.
Toolbar
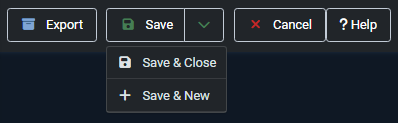
- Export : This will allow you to download a CSV file of the statistics for further processing via Microsoft Excel and other tools handling this common data format. This feature is only available with HikaShop Business.
- Save & Close : Save the report and return to the reports management screen.
- Save : Apply the modifications to the report and stay on the same screen.
- Cancel : Return to the previous screen without saving the modifications.
- Help : This button enables you to turn ON/OFF the help section, this screen will appear or disappear.
Set the main information: Current report

- Name : Here you have to define the name of your report.
- Published : When your report is published, it is displayed on the dashboard.
- Access level: You can restrict the report from being displayed to some joomla groups of users.
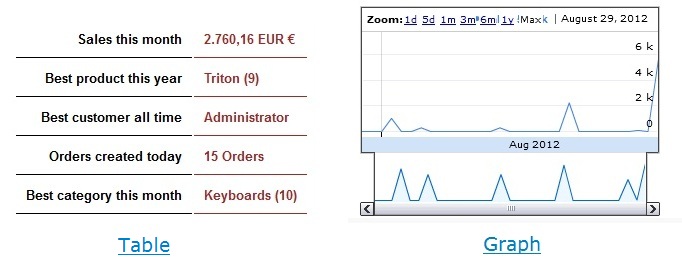
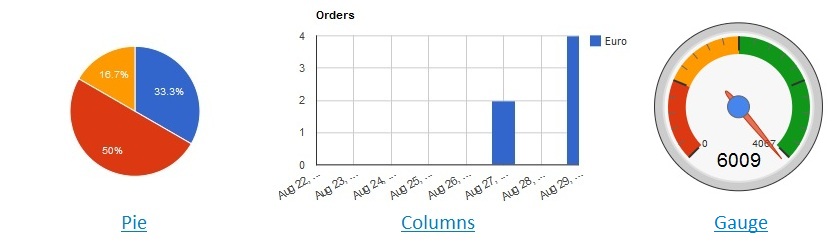
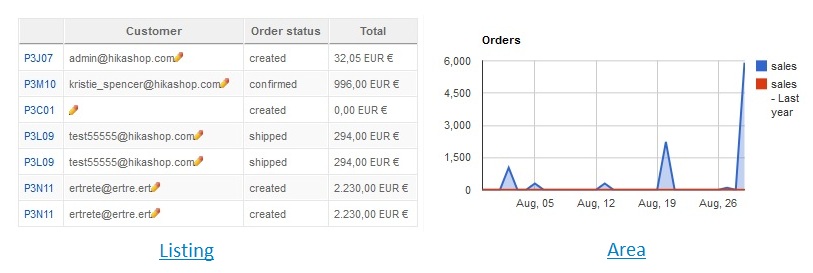
Choose your kind of report: Display

- Display Type : Define the display type of report which will be generated. See below to know what each type looks like.
- Date Type: Choose here the date type used to generate the report.
- Group items per: This option gives a more readable report by allowing you to group your items per days, months, year or hours. Thus, when you want to see you sales for the last year you can choose to group them by month in order to get a chart with 12 points or columns.
- Period: Define the period on which the report is based. You can either choose a predefined period (this year, this week...) or define a specific period.
Note : Please, make sure that your server and website are configured with the same timezone to avoid any issue. As otherwise, you might notice discrepancies in the way the date restrictions are applied
Here are the different display which are available:
Data Type: What do you want to visualize?
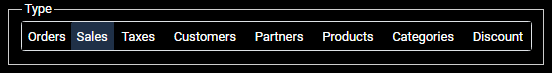
- Type: In this section you have to define the type of data on which your report will be based. Since every display type doesn't present the same kind of information, some types will be available only for specific display.
- Orders: The number of orders
- Sales: The amount generated by your orders
- Taxes: The amount of tax paid on your orders
- Customers: Your customers
- Partners: Your partners
- (for those last two types you can choose among multiple sources of data)
Display options: Filters and compares
This section is the most important if you want to generate a customized report fitting your needs. Filters and compares allow you to generate a report on a specific category as well as for a specific currency or compare the sales for your 5 best products. The filter section will for example filter the data in order to use only specific elements for the chart.

- Order Status : You can choose here the order status of the visualized orders. Indeed, you can display only the shipped or created orders as well as the confirmed orders only. You can select multiple status with the CTRL key of your keyboard.
- Currency : Display the orders paid with the selected currencies.
- Shipping method : Display the orders using the selected shipping methods.
- Payment method : Display the orders using the selected payment methods.
- Categories : Display the orders with products in the selected categories.
- Include sub categories : Include or not the sub categories of categories selected above.
- Products : Display the orders including one or more selected products.
- Coupons : Display the orders including one or more selected coupons.

The compare section allows you to generate compared reports. Thanks to this options you will for example be able to generate a report showing the sales of this year and the sales of last year, giving you the opportunity to compare the evolution of your shop between the two years.
- Compare : You can choose to compare your data either on a period or on a value base. Values will allows to compare orders and sales dividing them on the selected criterias. If you check the products option, you will be able to see the sales of each product separately. These options are cumulative so you can see the evolution of your products' sales depending on the payment method. The period option will simply make a comparison between the sales of the chosen period (see above) and the sales made on the last same period (for example the last week if your defined period is this week) or on the same period last year.
- Limit: This option defines a limit to the number of lines/columns displayed. If you have 100 products and chose the product compare option, the report will be unreadable so you can set this option and only the best products will be displayed.
- Encoding format: Define the format of the exported csv.
Other options are available according to the selected type.

